Use balcony PV energy surplus
Step by step.
Step by step.
If you have invested in a balcony PV system, you will probably find that at the time of energy production, more energy is generated than the household currently needs. Where to put the surplus energy? Those who already have an energy storage system can store this surplus for later without having to worry about the profitability of the storage. For those who feed surplus energy into the grid, it will be remunerated, but probably not adequately.
How can consumption be sensibly adapted to energy production?
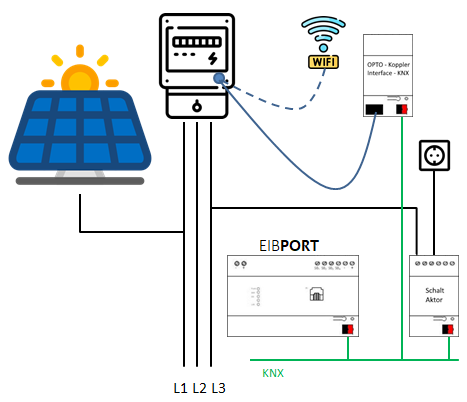
Nowadays, households have a 3-phase electricity grid. The energy connection meter records the total energy as a sum across all phases. Despite energy balancing across the phases, there will be a PV energy surplus at time intervals. One can adjust to the sun and run consumers when the sun is shining. A sensible option is to switch on energy-dependent consumers that offer an additional benefit. For example, one can use the surplus energy to heat with an infrared panel, operate an air filter or use a pond or pool aeration (filter).
The following example generates a switching pulse when there is an energy surplus in order to switch consumers or a socket. When the surplus is over, the switch-off takes place according to further specifications.
What is needed?
The current total consumption of the household can be read in quite easily as a KNX measured value via an opto-coupler from the house connection meter. Other solutions are couplers or additional meters that make the power value available in the local network. These possibilities are, for example, the Shelly-EM measuring transformer or TASMOTA radio modules, where the measured values are queried via http request and transmitted to the KNX (see separate info sheet). The provision of values and the creation of switching thresholds for controlling the additional consumer is carried out in a logic group in the EIBPORT. In order to be able to use different consumers as required, the switching threshold must be changeable. The consumer (socket) is switched via a KNX switch actuator.
For the evaluation, setting of parameters and display, the visualisation of the EIBPORT "Control L" used. Control L is web-based and can thus be run independently on mobile devices. To realise the above application, a logic group must be configured. For this purpose the LOGIKEDITOR at the EIBPORT and the logic group can be imported or created.
Logic elements are required for the logic group and can be selected under "+ Add".

The following 2 input values must be taken into account:
The function elements used in the example are:
The values are operated and displayed in the Control L WEB visualisation, which enables simple and fast value display in the browser for any end devices, e.g. smartphones.
The element "Value display" is used to display the values, taking into account the DPT used. The "Switch" element is used for enabling. The additional load value is also entered via the "Value display" element, but the sending of the value is activated here. The switch status is displayed as dynamic text.
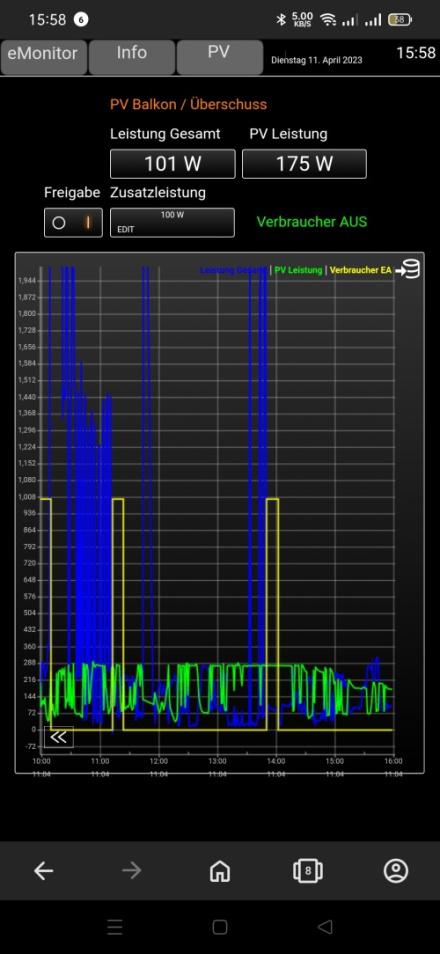
For the graphical representation, the element "Graph" is used, whereby the long-term recording has been activated for the three values shown.
Due to high differences in the value ranges of the respective values, special settings are required for a common display. Within the graph, it is possible to zoom in for a detailed evaluation. The high power peaks in the total power (blue) are generated by a 3-phase instantaneous water heater in the example. In contrast, the power of a balcony power plant (green) is quite low. Therefore, a range of values was set for all powers from -100 to 2000 W.
The switching pulse shown (yellow = switching of additional consumption) was enlarged by a factor of 1,000 to improve the display. Due to the display width of a smartphone, the time interval was set to 6 hours.
Hint: The switching curve (yellow) shows a number of load switching operations that were carried out because the switching threshold was undercut. This may also have been caused by short value outliers. A remedy is a statistics element that is integrated into the logic group, in which an average value is determined from 3 to 4 values, for example.